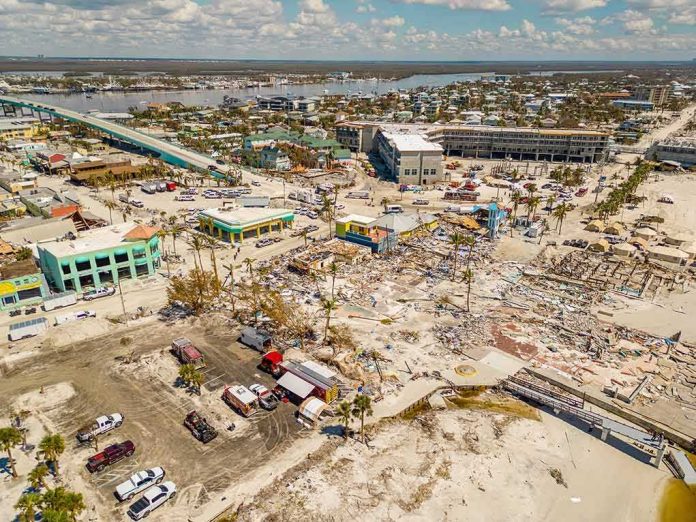
When a classic nor’easter spins up along the Eastern Seaboard, the most consequential decisions happen before the first street floods: governors mobilize, coastal towns brace for onshore wind and astronomical tides, and millions of people shift plans because the physics of wind, water, and shoreline geometry make certain outcomes—coastal flooding, beach erosion, power disruptions—both predictable and dangerous.
At a Glance
- Governors in New York and New Jersey declared states of emergency ahead of the coastal storm, part of a broader East Coast activation.
- Official forecasts highlighted hazardous winds, coastal flooding of 1–3 feet above high tide in places, and damaging surf.
- Coastal communities reported flooded roads, dune overtopping, and beach erosion; tens of thousands lost power as winds strengthened.
- Transportation was disrupted: airlines and Amtrak issued waivers as conditions deteriorated along the corridor.
What makes a nor’easter dangerous: the mechanism behind the headlines
Nor’easters are cold-season coastal lows that intensify along the temperature contrast between Gulf Stream waters and the continental air mass. The defining hazard is the prolonged northeasterly fetch—wind blowing over long distances across the Atlantic—stacking water into bays and back-barrier estuaries. Unlike a fast-moving thunderstorm, a nor’easter sustains onshore flow for multiple tide cycles; the water that arrives with the morning high tide often fails to fully drain before the evening high returns, which ratchets up inundation. Forecasts correctly emphasize wind and coastal flooding because those forces drive most damage: dune erosion, overwash onto roads, and tree and powerline failures that lead to outages.
In this event, meteorologists warned of coastal flood threats from the North Carolina Outer Banks through New Jersey and into New England, with seas building well offshore and pushing energetic surf onto vulnerable beaches. Coastal flood watches and warnings, combined with full or near-full moon tides, raised the ceiling for back-bay flooding in places like Barnegat Bay and the back lagoons of Long Beach Island in New Jersey, as well as the tidal inlets of Long Island’s South Shore. Onshore winds—frequently the primary threat in a nor’easter—were forecast to reach gale to storm-force gusts in exposed locations, compounding treefall risk on saturated soils.
Emergency posture: why states moved early
Emergency declarations from governors are not rhetorical flourishes; they are legal tools that unlock staffing, equipment pre-positioning, mutual aid, and procurement flexibility. Ahead of the storm, the governors of New York and New Jersey declared states of emergency as advisories expanded and coastal flood guidance sharpened, matching a familiar East Coast pattern in which forecast confidence, not damage tallies, dictates timing. FEMA’s daily operations briefings during analogous coastal events have also recorded activations across the Mid-Atlantic, reflecting a regional risk profile that can shift hour by hour with track and tide.
Local governments used those declarations to stand up public works and coastal protection measures—temporary berms on Long Island barrier beaches, tide-gate and pump operations in known low spots, and pre-staging of chainsaw crews and utility contractors. The operational goal is straightforward: reduce response time when the first flooded intersection, downed feeder line, or stranded vehicle turns into dozens.
Observed impacts: flooding, erosion, power loss, and travel disruption
As the nor’easter matured, water covered roads in multiple coastal towns, especially where back-bay geometry and wind direction align to trap water. New Jersey’s barrier islands—Ship Bottom, Sea Bright, Ocean City—saw street flooding and surf-driven erosion of the foredune as high tides coincided with the strongest onshore winds. Similar scenes played out on Long Island’s South Shore, where municipalities built sand walls to shield oceanfront homes, and along pockets of coastal Massachusetts where seawalls concentrate wave energy and overtopping becomes likely near peak tide.
Power outages followed the wind field: tens of thousands of customers lost electricity during the storm window as gusts toppled limbs onto distribution lines. Those outages are tightly correlated with soil saturation and canopy characteristics; coastal and riverine towns with mature trees and older overhead infrastructure tend to see the worst of it. This storm also rippled through transportation systems. The airlines and Amtrak issued no-fee waivers and schedule adjustments—an industry-standard risk control when airport crosswinds, low ceilings, or corridor washouts threaten cascading delays.
How forecasts map to measured reality
Good coastal forecasts translate dynamical models into actionable thresholds: expected coastal flooding of 1–3 feet above high tide is a clear signal to move cars off low blocks and elevate critical equipment. In New England, wave guidance topping 20 feet offshore means accelerating dune toe erosion and a higher chance of overwash on the most vulnerable approaches. These were not abstract numbers for this storm; they aligned with inundation in back-bay neighborhoods, dune scarping along open beaches, and a step-up in reported road closures at each successive tide.
Measured water levels at tidal gauges often rank a given tide among the historical peaks for a location—context that matters for risk memory and future mitigation. When forecasters briefed on 60 mph-plus gust potential along outer capes and barrier islands, that signaled likely feeder outages and tree damage in the same corridors that repeatedly underperform in wind events, a pattern utilities incorporate into crew staging and vegetation management.
NOR EASTER
🚨 Nor'easter lashes East Coast, floodwaters flow through coastal neighborhoods
Sep 27,2026
A powerful nor'easter that's drifting near the New Jersey coastline Sept. 27 will continue to bring coastal impacts and unsettled weather from the Mid-Atlantic to New England… pic.twitter.com/GQr1Jq9yr7
— Sid (@Trending_Sid) September 27, 2026
Why some places get hammered while others get a glancing blow
Impact heterogeneity in nor’easters is not a failure of forecasting; it is baked into coastal morphology and storm structure. A modest shift in the low’s position can swing the longest fetch onto a different shoreline, changing which back-bay networks trap water most efficiently. Barrier islands with narrow inlets and extensive lagoons—common along New Jersey and Long Island—are primed for back-bay flooding under persistent northeast winds, while open-coast headlands with engineered seawalls might see more wave overtopping than standing water in streets. Inland, the same wind field that piles water onshore is just a wind event; treefall and power loss dominate there, not inundation.
What this means for preparedness and recovery
The operational lesson is consistent. Households and businesses in flood-prone zones should treat coastal flood watches and wind advisories as triggers for specific actions: relocate vehicles, secure outdoor equipment, charge backup power, and, where available, set sump pumps to automatic with check valves inspected. Municipalities can reduce recovery time by pre-positioning temporary barriers at known overtopping points and by clearing catch basins ahead of the first tide cycle. For utilities, the recurrent signal is vegetation and pole-line hardening in the same coastal feeders that fail under gale conditions.
The assessment phase inevitably lags the storm. NOAA and partner agencies often conduct aerial imagery and post-storm surveys to quantify beach volume loss, dune scarping, and infrastructure damage—work that converts weekend headlines into datasets that inform nourishment projects, setback policies, and resilient design standards. These standardized records close the loop between forecast guidance and capital planning, ensuring that the next nor’easter encounters a coast marginally better prepared than the last.
Sources:
disasterphilanthropy.org, fmcsa.dot.gov, dhses.ny.gov, disastercenter.com, drought.gov, en.wikipedia.org